
Overview
The Project Dashboard is a configurable widget board summarising a project's activity, inventory totals, and open to-dos — without opening every location.
ℹ️ Who can use this: Anyone with view access can open the dashboard. Administrators and Project Managers can rearrange widgets and add tabs.
Opening the Project Dashboard
- Open the project from your home screen.
- Click Display Project Dashboard (top-right of the locations page).
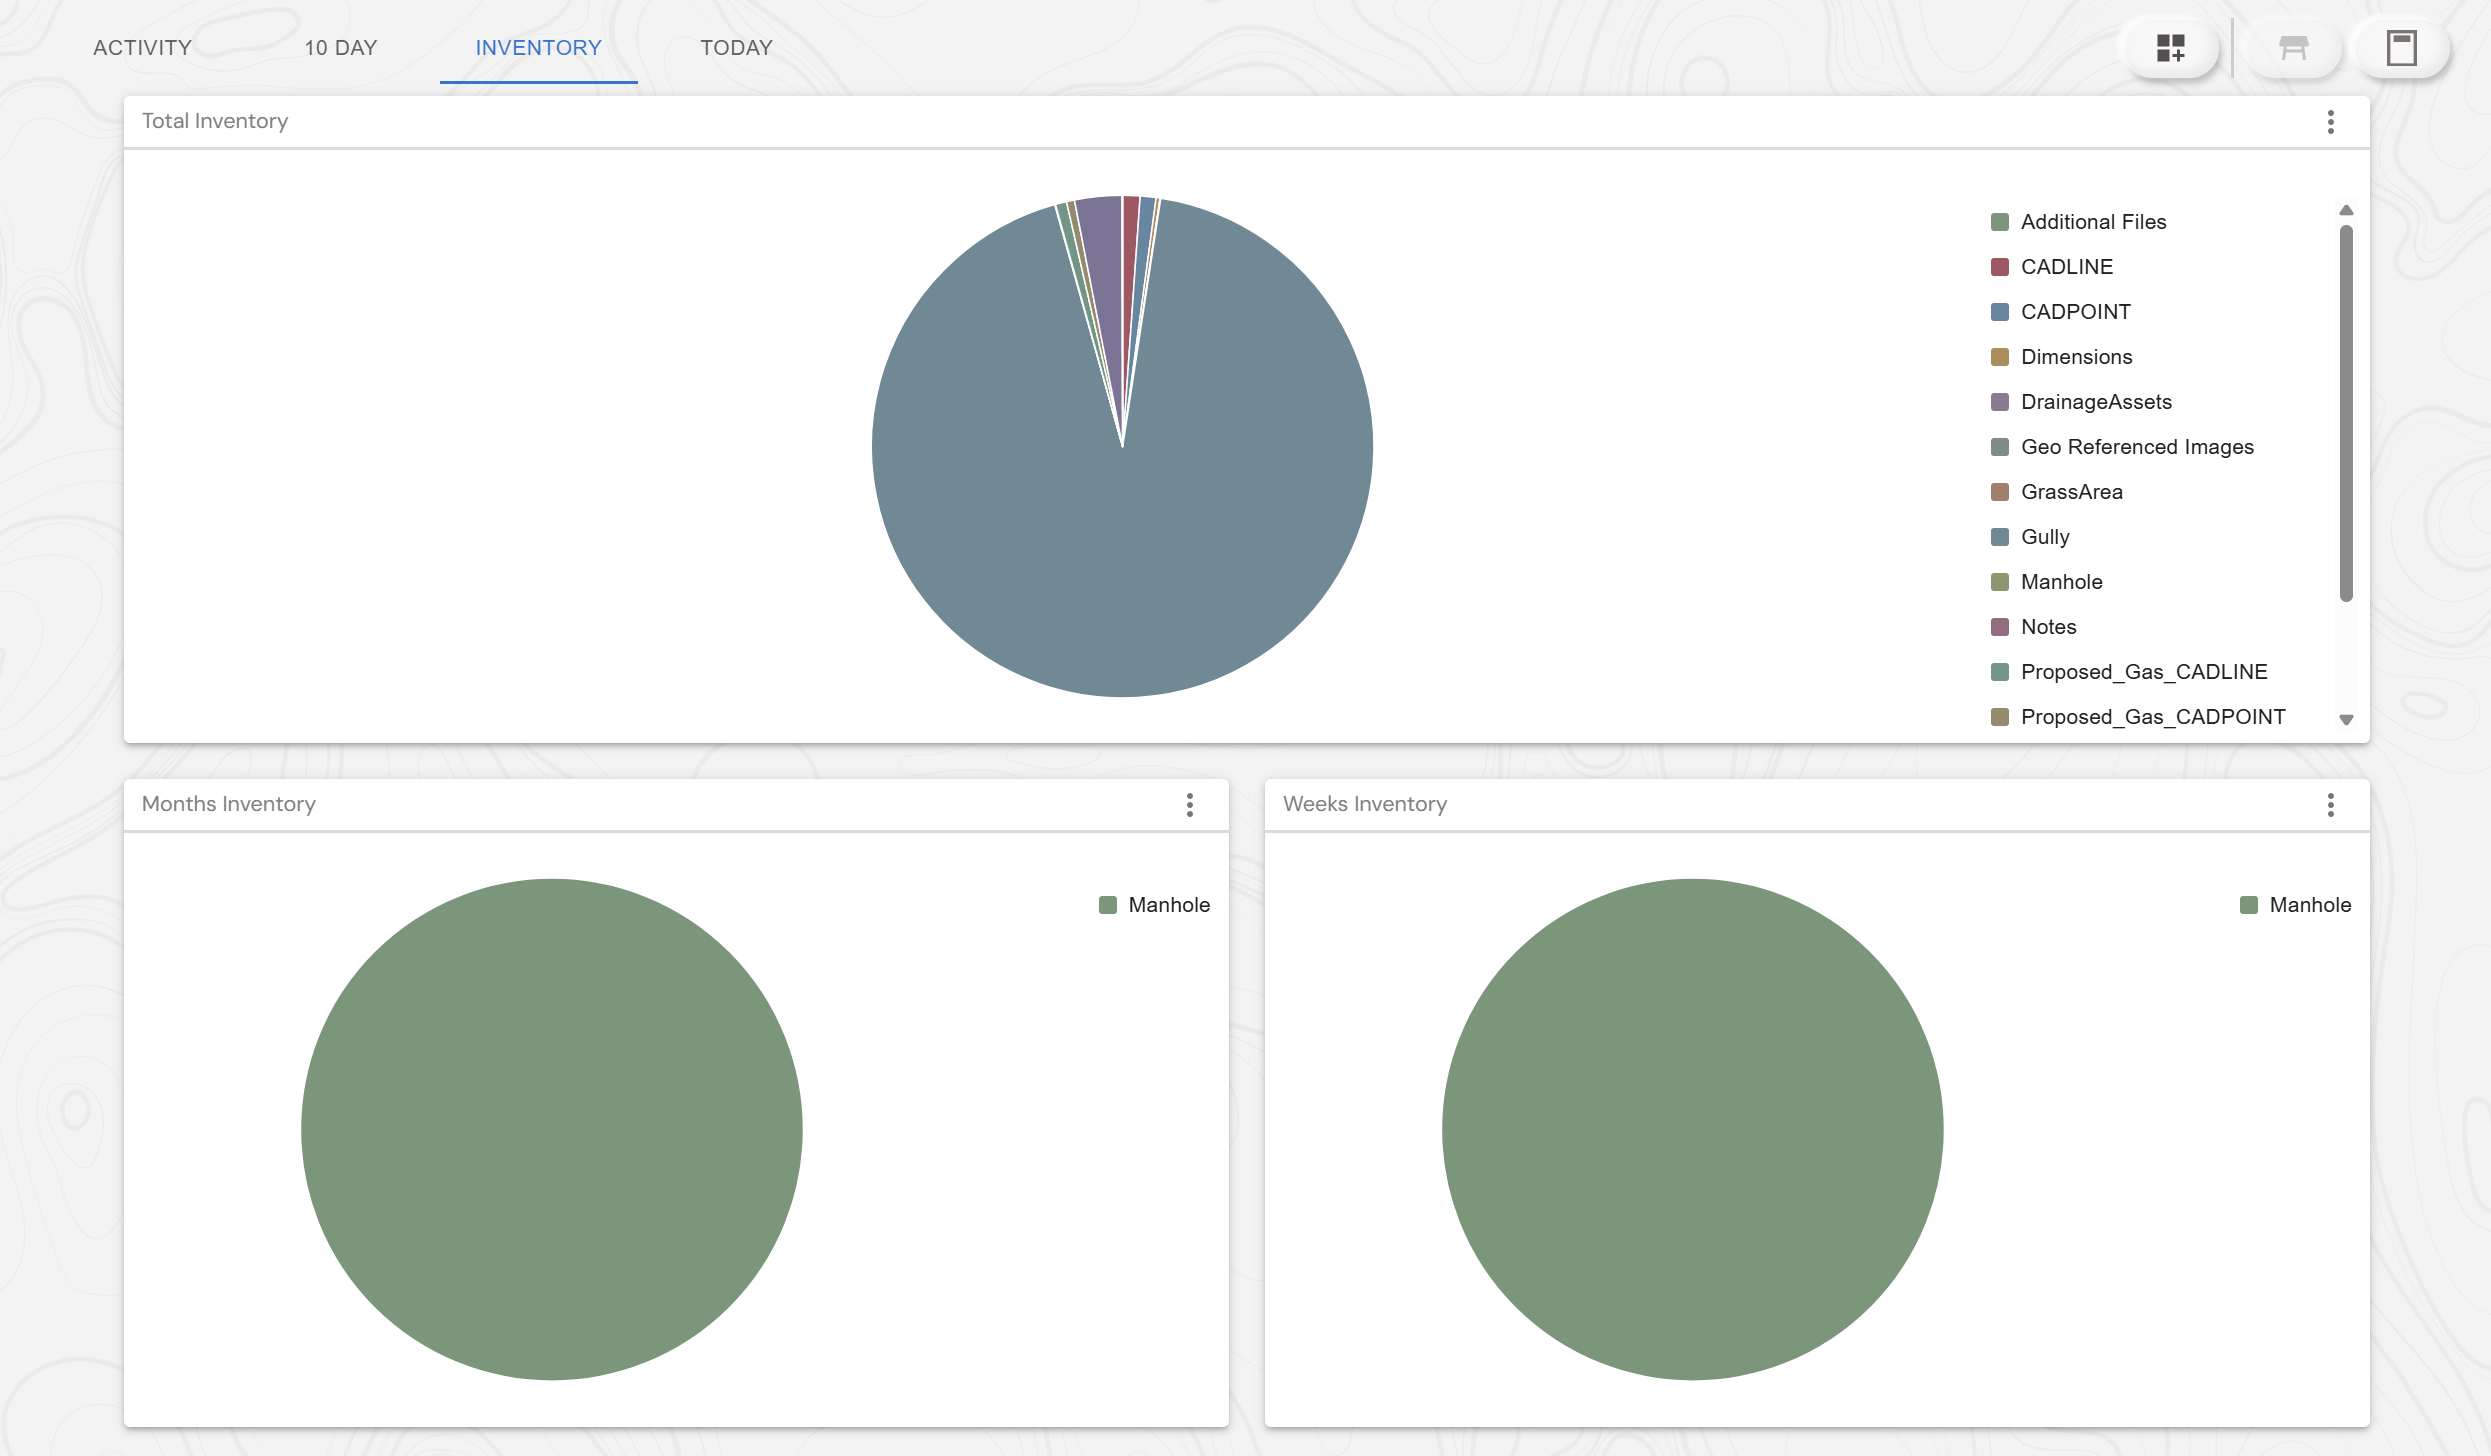
The Three Default Tabs
Editing the Dashboard
Administrators and Project Managers can customise tabs and widgets.
- Click Edit Mode at the top of the dashboard.
- Click the pencil icon on a tab name to rename it.
- Click + to add a tab.
- Use each widget's 3-dot menu to remove or configure it.
- Click Exit Edit Mode to save.
Table vs Chart View
The toggle (top-right) switches the active widget between charts and a flat table. Use Table to copy numbers into a report; use Show Header to compact the layout when projecting on a screen.
⚠️ Note: Layout changes are saved per project, not per user — every team member with access sees your changes. Coordinate with your Administrator before reorganising shared dashboards.
Common Questions
Why are some widgets empty?
Widgets show empty charts until your team uploads data or creates features, after which they populate automatically.
Can I share a dashboard link?
Yes — bookmark /dashboard/project/{project-id}. Anyone with project access sees the same dashboard.
Can mobile-only users see the dashboard?
The dashboard is portal-only. Mobile users' submissions feed the widgets automatically.
What's Next?