
Overview
Soarvo dashboards summarise the data in a project — feature counts, attribute breakdowns, and progress — as tables and charts. The dashboard lives at the project level.
To display the Project Dashboard click the button in the project view on the home screen 
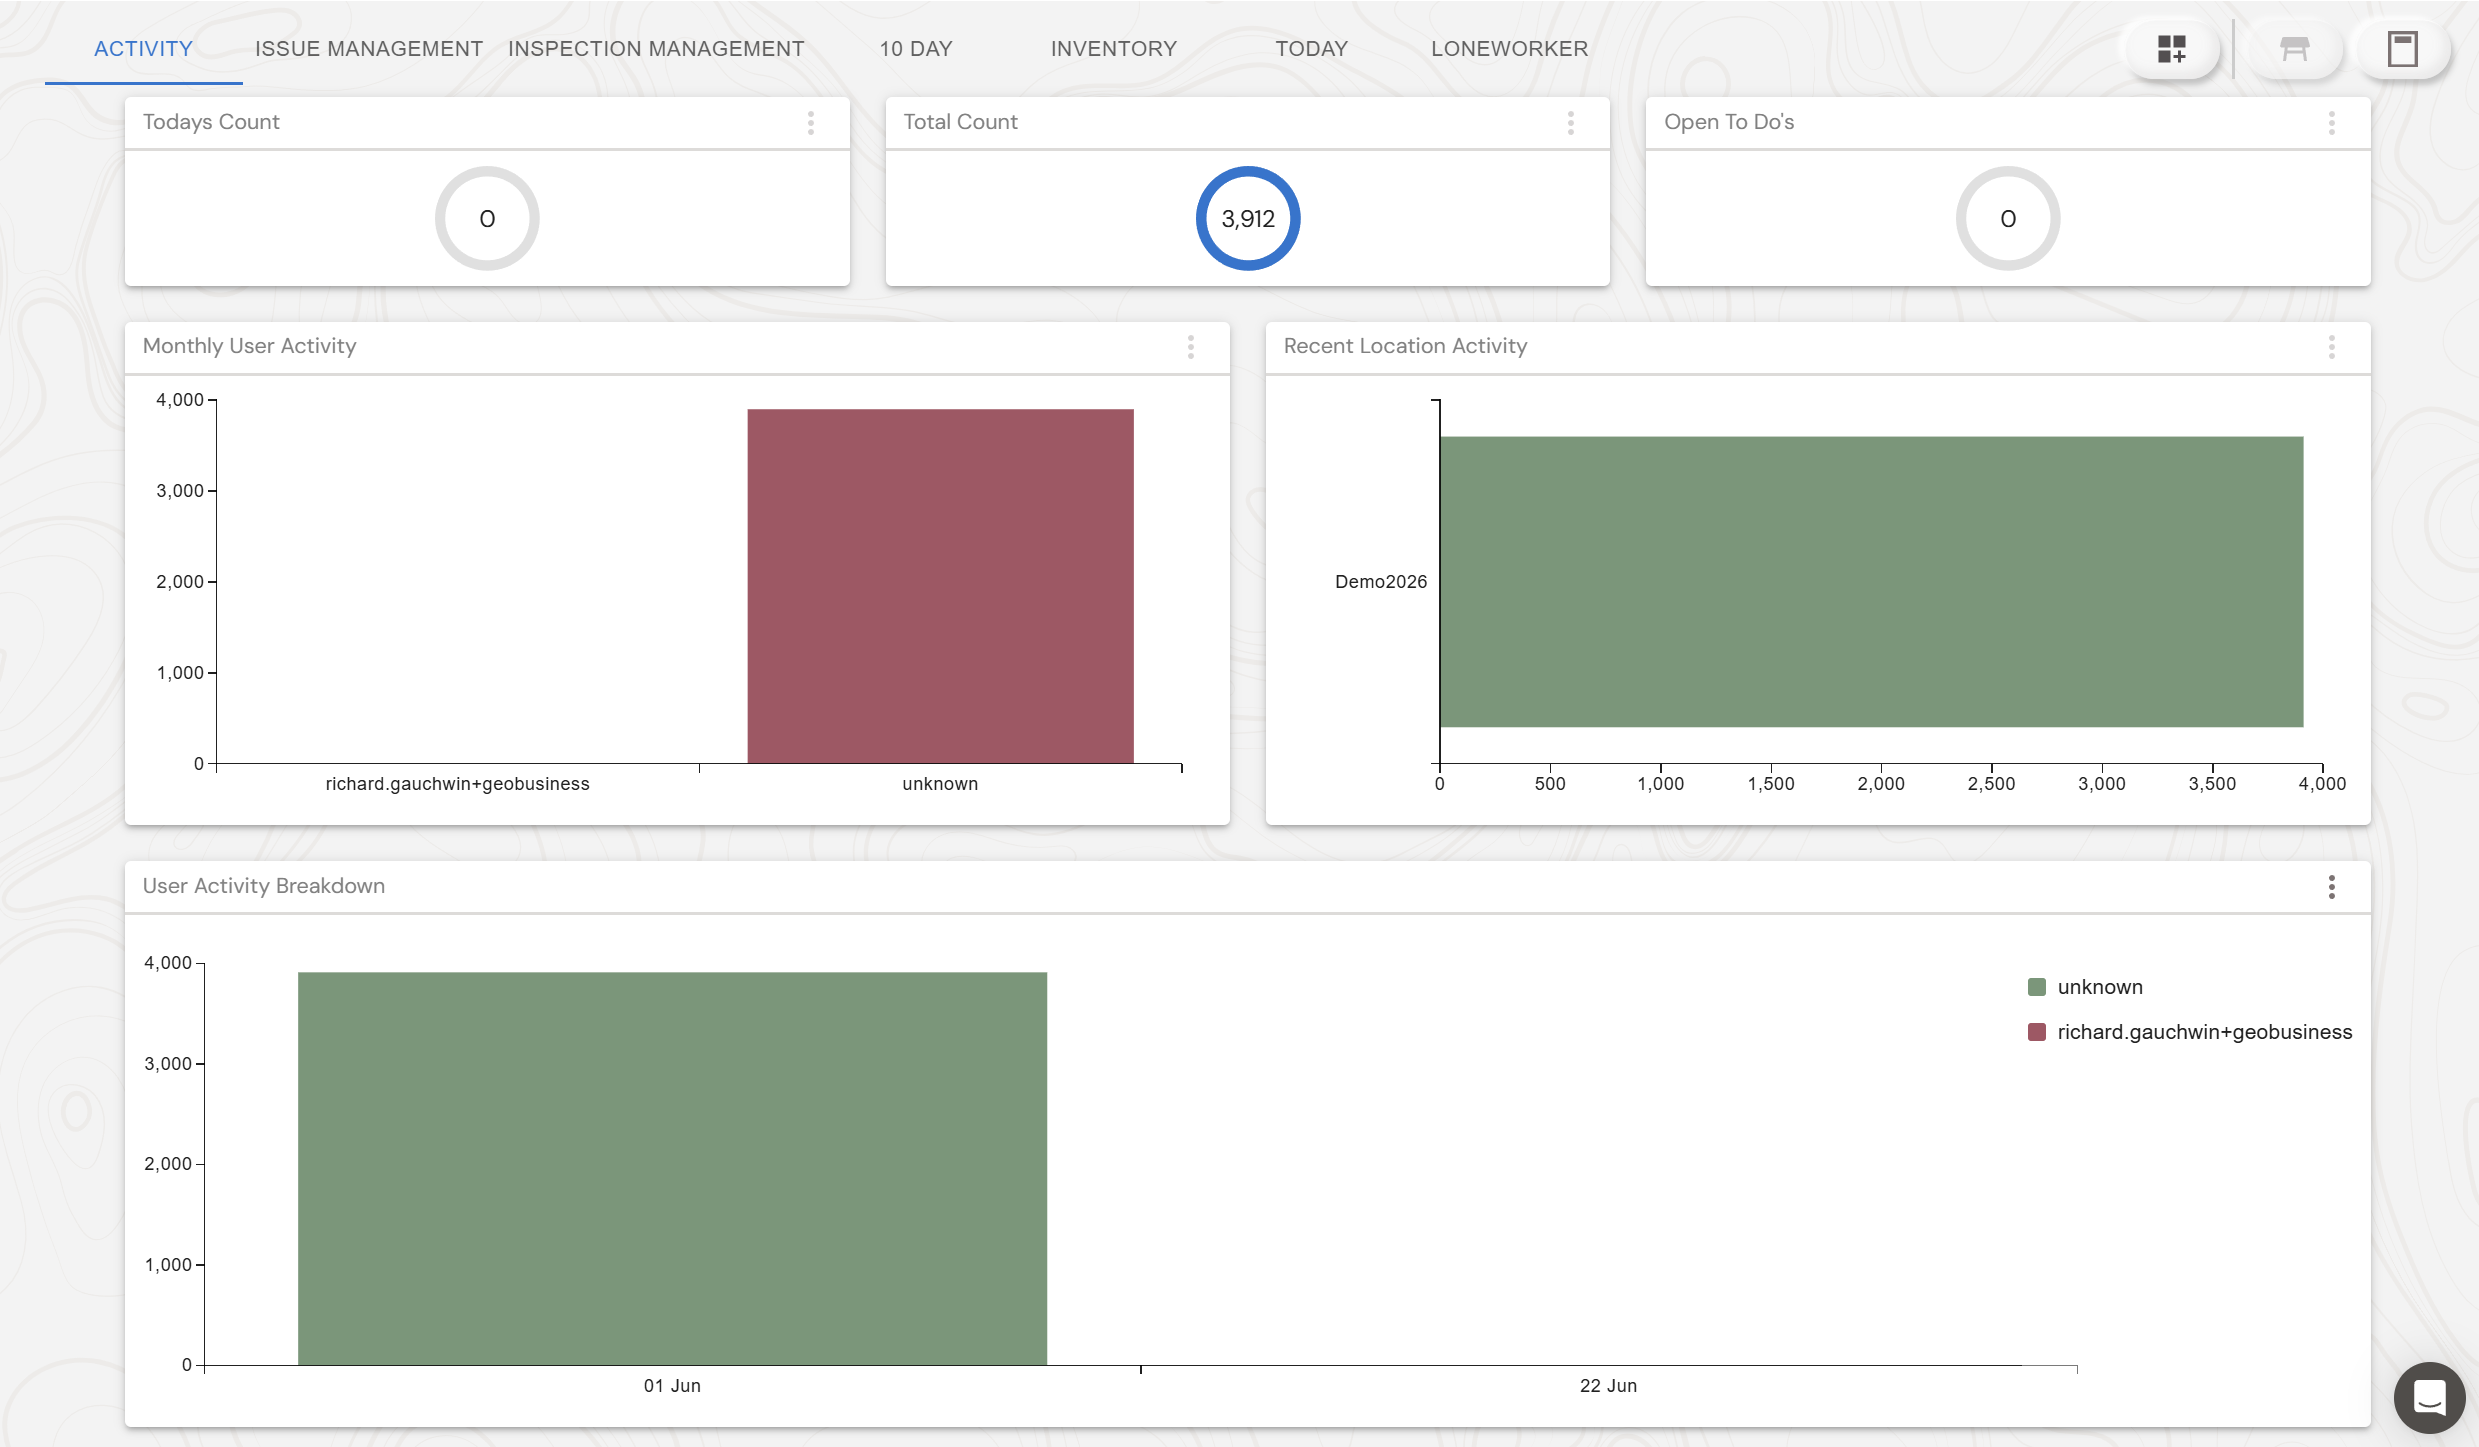
This will display the default dashboards. For customisation or bespoke dashboards please contact Soarvo Support
What's next?